Tell Data-Driven Stories
with Sensors in Your Pocket
Build, prototype and share notebook-style data dashboards called Story with recordings made using the Sensor Logger app with ease. Visualise data using plots and maps with advanced customisations, and interlace them with text, images and other contextual data. Everything is interactive, so zoom, pan and delve into your data, without losing sight of the big picture story. Story also supports data transformations such as smoothing, taking derivatives and even frequency analysis in just a few clicks.


Click on any screenshot for a live demo with real data you can explore and play with. To get started with Story, download the Sensor Logger app.
From Sensors on Phone to Graphs on Screen in Seconds
Story is built for Sensor Logger, the easiest way to log sensor data from a range of sensors on Android, iPhone, Apple Watch, iPad and AirPods. For any recording you have made, upload it to Sensor Logger Cloud with a single tap, and then it can be used with any Story. From there, you can swap, drop and reuse any recording, at any time and on any Story. Attach one recording, or attach multiple to cross-compare them. You can also share these recordings with others so they can visualise and analyse them. No more copying, transferring, managing and importing CSVs or spinning up Python environment or notebooks. Everything runs in the browser within nothing to install.
How Stories fit into the larger Sensor Logger ecosystem.
Stories are seamlessly integrated with Sensor Logger, so it has a deep understand of the sensors, tables, fields, units and coordinates of everything Sensor Logger generates — so you can worry less about the schema and spend more time playing with your data.
Build, Prototype & Tell Any Story
From a custom run tracking dashboard and race track analysis, to a science lab and vibrational analysis reports , you’re only limited by your imaginations (and your sensors and physics). Here are some sample Stories with real data for you to explore. Story currently supports these data visualisation types:
Time series
2D graphs and maps
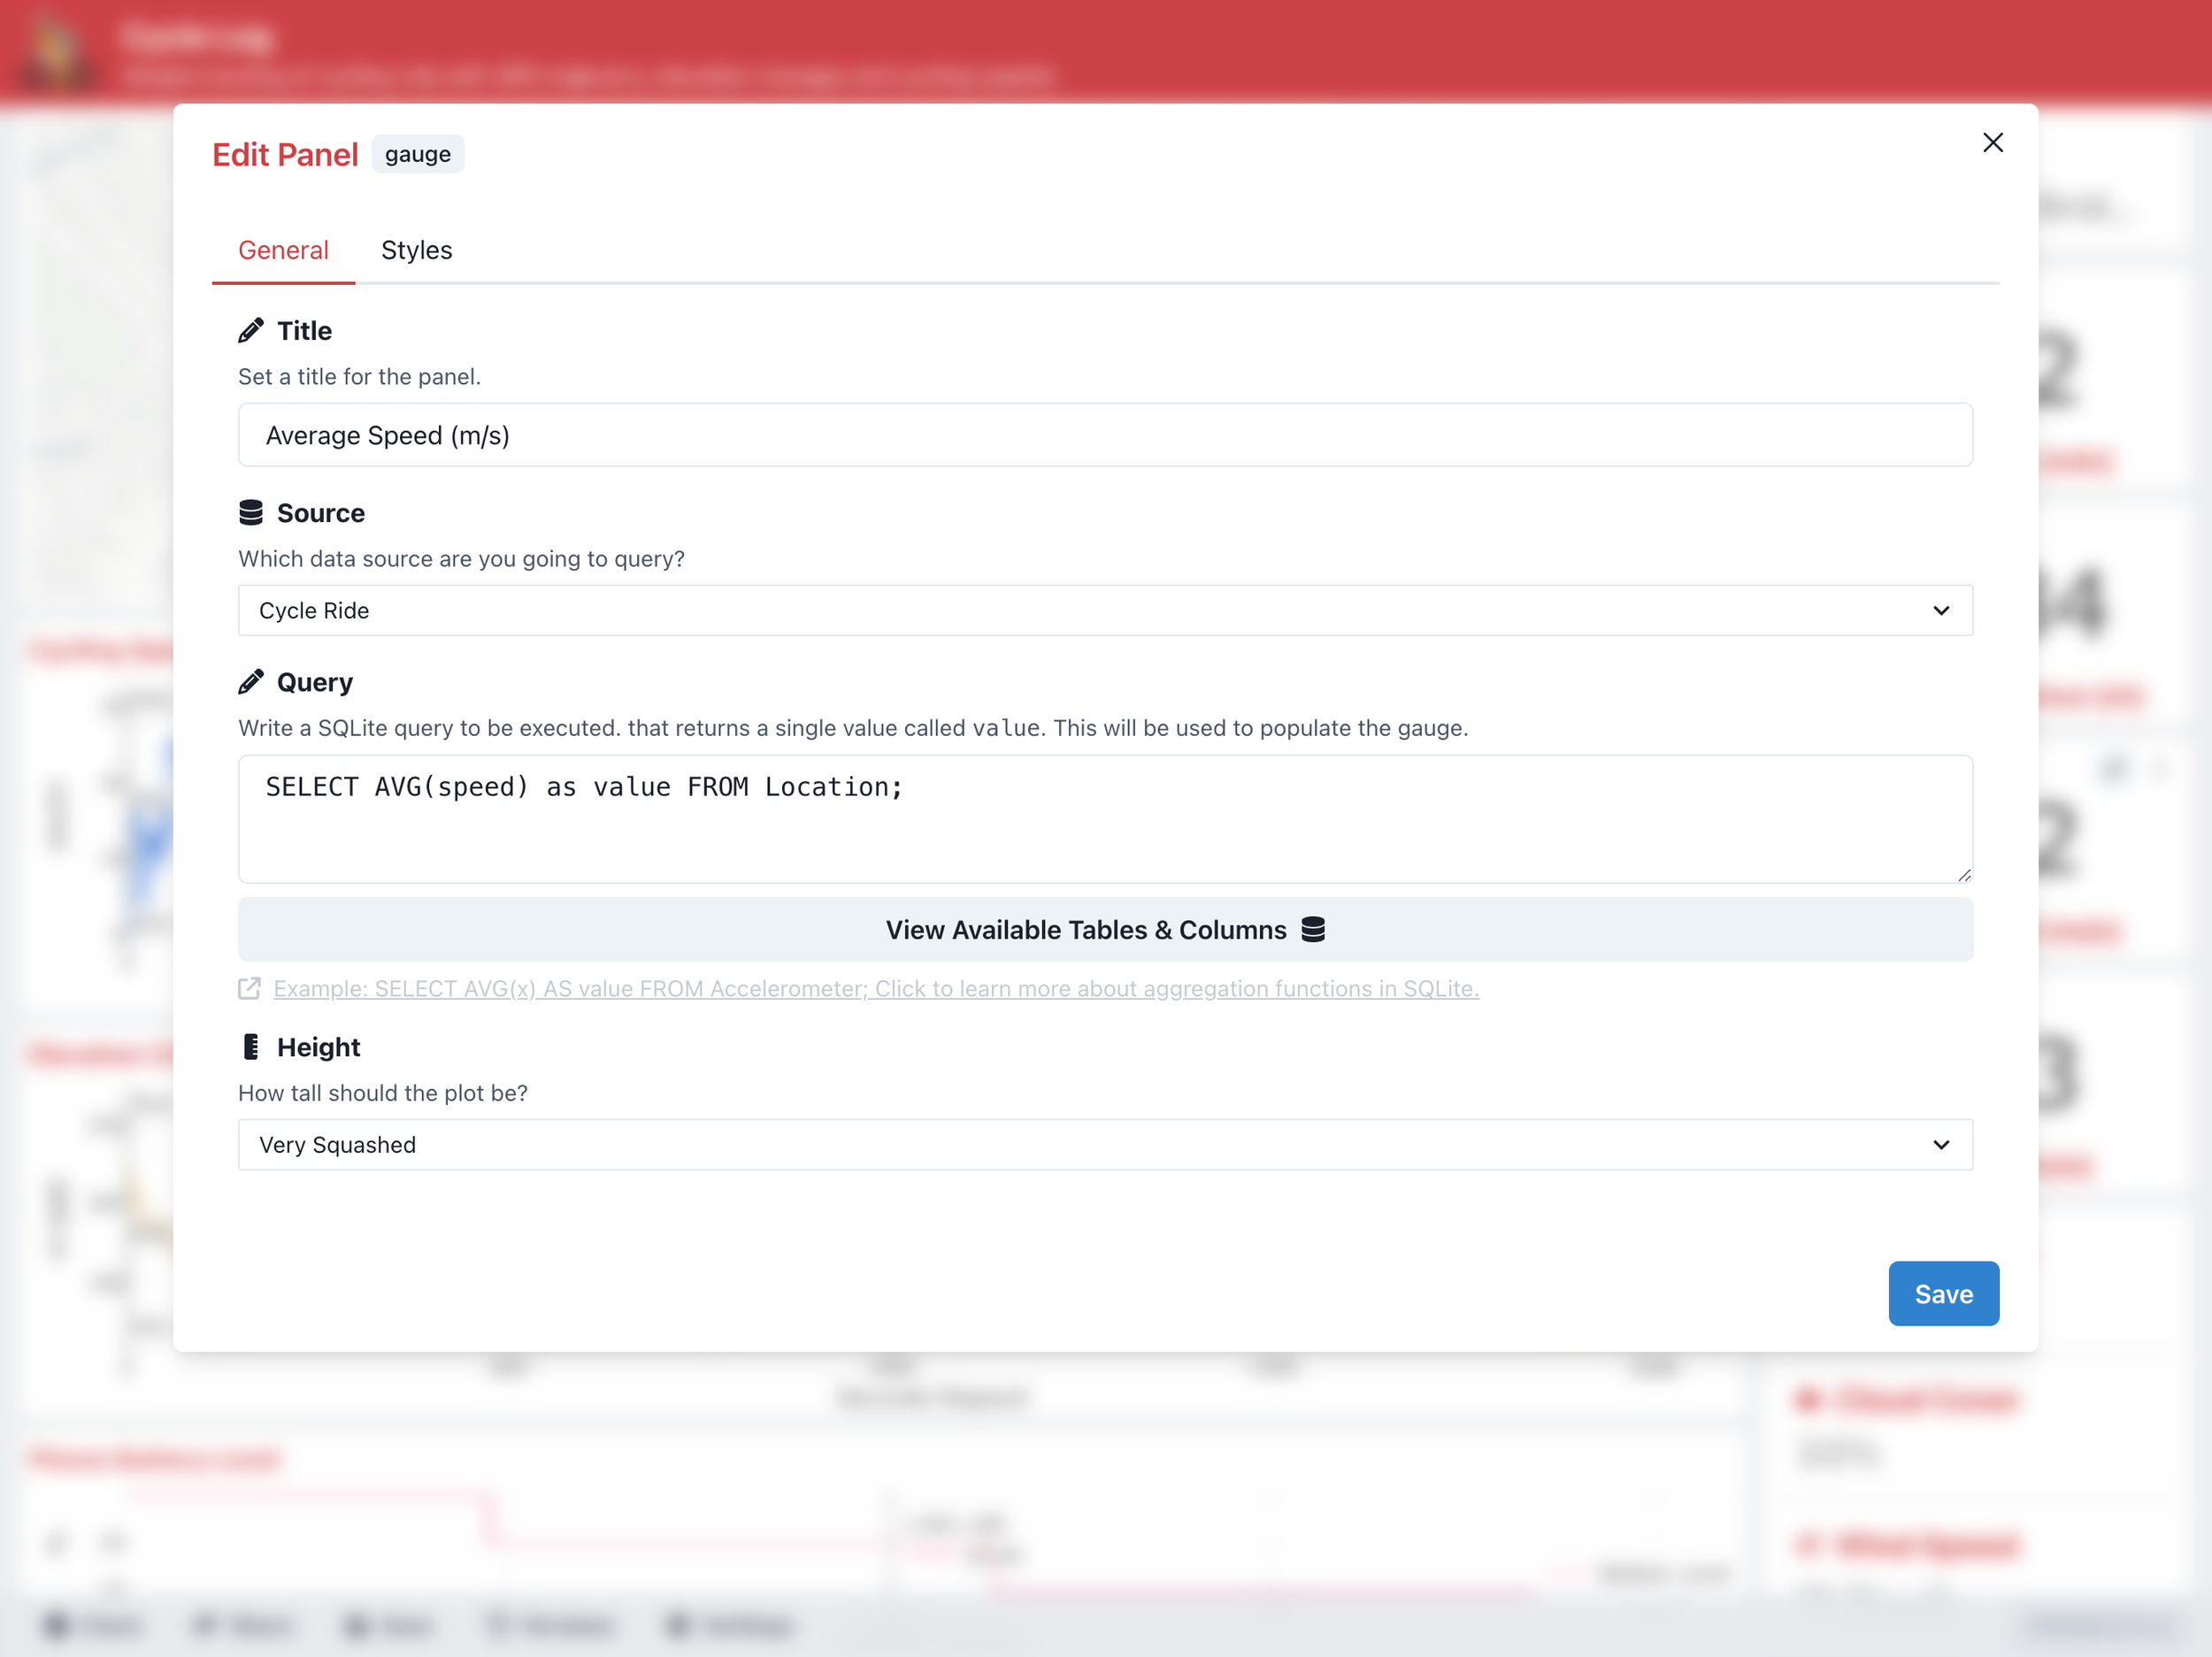
Gauges
3D graphs (Coming Soon)
Markdown text, links and callouts
Images
Weather, metadata and reverse-geocoding

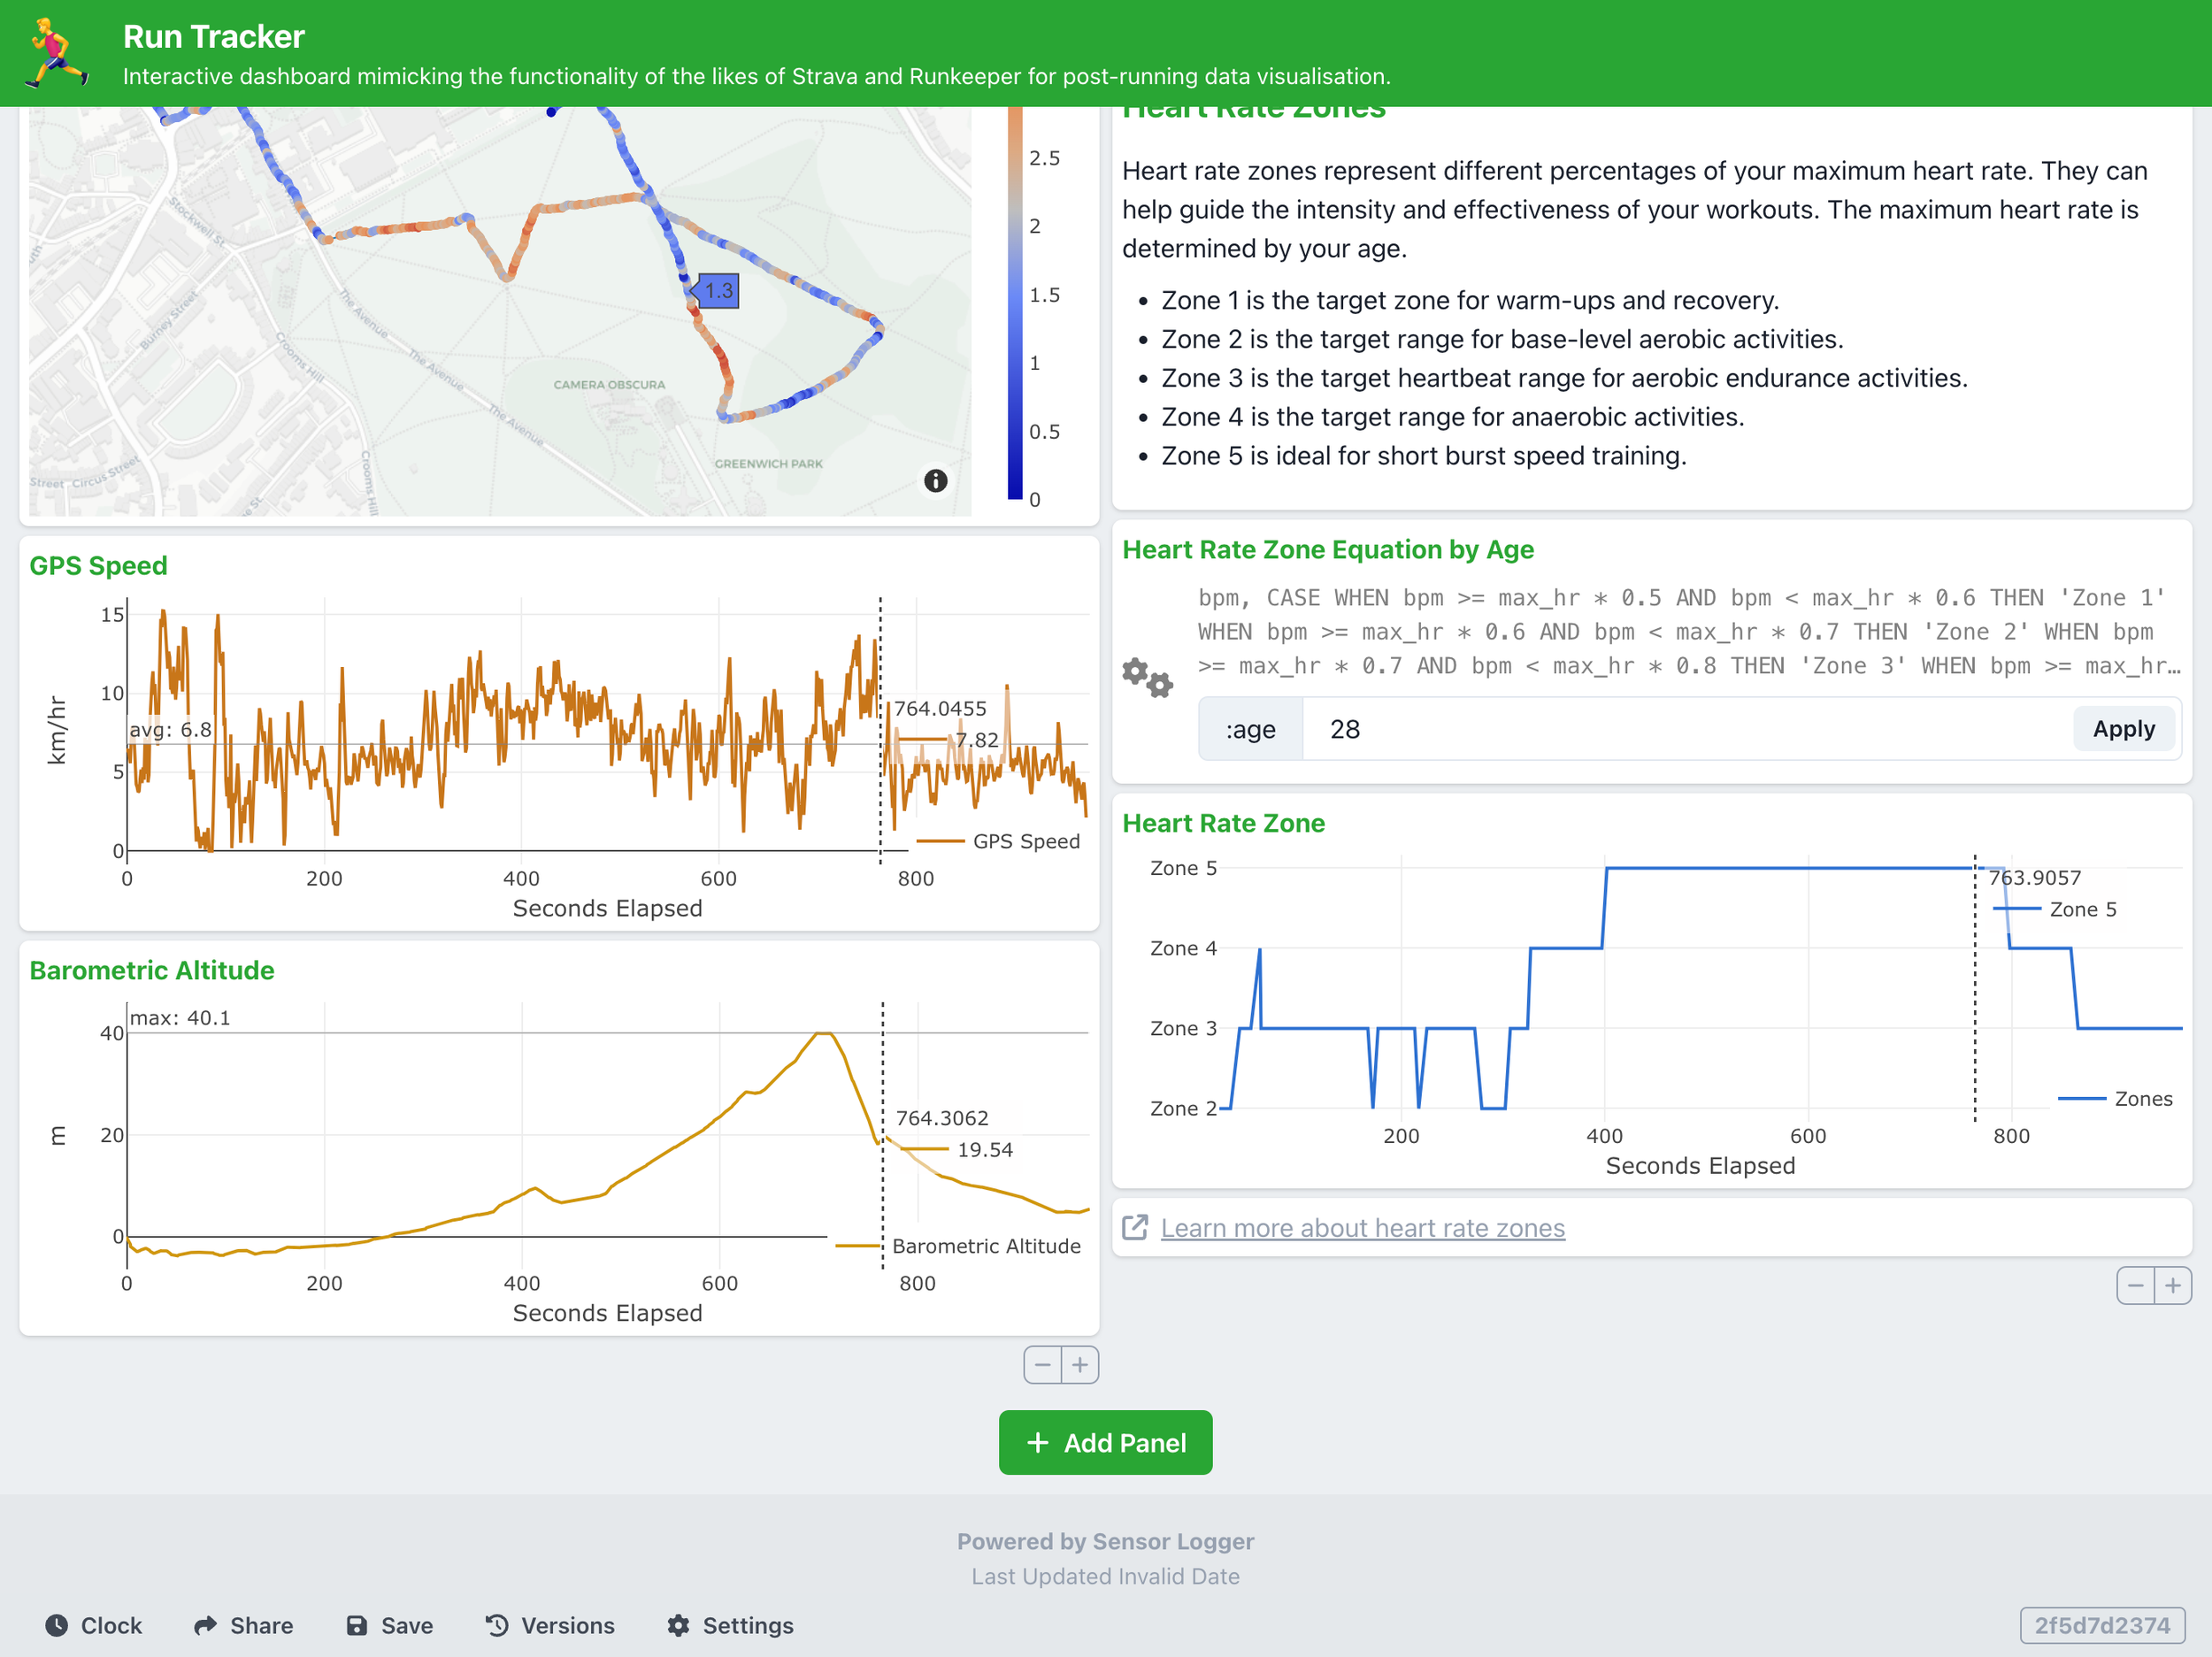

Time Series & Geo-Spatial as First Class Citizens
Story is built for sensor based time series and trajectory data, so it has all the tools you need to analyse and visualise them built-in.
Linked time cursors
Synced temporal axes
Global clock filtering
Global geo-spatial filtering (Coming Soon)


Cloud-First & Compatible Everywhere
Story is hosted on the web, making sharing and accessing your data dashboards incredibly easy. There’s no need for complicated sign-ins or management nor need to install or spin up any coding environment; simply share a link to your Story, and optionally share with secret codes, pointing to any attached recordings. While Story is primarily designed for viewing on a computer, it is fully compatible with mobile devices, ensuring your data is accessible and interactive on-the-go.


Craft Your Data Pipeline As You Craft Your Story
Story is not just a data visualisation tool but is also a powerful data analysis tool, driven by transformation panels. These panels take your data, and transform it into new, derived data for further analysis. Chain these panels up and you can build a very powerful data processing pipeline, right alongside your story telling. Some out-of-the-box transformations include:
Temporal shifting and offsetting
Taking magnitude, derivatives and integration
Data smoothing, rolling average, minimum, maximum
Unit conversion
Thresholding and categorisation
Fourier transform


Robust, Rapid, Reactive & Reproducible
Story processes and prepares your visualisations directly in your browser—no data processing takes place in the cloud. Once your recording is downloaded, all actions happen on your device, ensuring a fast, responsive, and secure data analysis experience. Story's reactive nature means that as you update and refine your Story, the components on the page automatically re-render to reflect your changes in real time. Additionally, everything you build in Story is reproducible, crucial for maintaining reliable and consistent data analysis, especially if you share your Story with others.


BYOSQL (Bring Your Own SQL)
Story offers powerful transformation and data processing options out-of-the-box with no coding required. However, if you're comfortable with SQL, you can take your data processing to the next level by writing custom SQL queries. This flexibility allows you to perform virtually any data processing task you need. To help you get started, Story includes a collection of example queries that demonstrate common data transformations and analysis techniques. You can easily modify these examples to suit your specific needs, providing a smooth transition into custom SQL use. Story uses the SQLite flavour of SQL. You can also inject variables inside the query, which can be changed dynamically by any user of the Story.


Share, Remix & Management
Story encourages sharing and remixing. You can attach your recordings to any Story shared with you. Any Story can be duplicated and be used as template to jumpstart your own data analysis. Stories are built and shared on the web, but are managed within the Sensor Logger app. Inside the app, you can create and duplicate existing Stories. You can also browse one of the many templates available.


Pricing
Story is absolutely free to use — build as many as as you want. The only chargeable aspect of the system is the usage of Sensor Logger Cloud, which stores all your recordings in the cloud. Everyone gets 100mb for free. If you use recordings others have uploaded, it will not count against your storage. You can upgrade your storage in the Sensor Logger app, which also comes with a whole host of other additional features to aid other aspects of your data collection journey.
Getting Started
To get started, download the Sensor Logger app and start creating Stories.
If you are running into issues with Studies or Stories, please check the current operational status of Sensor Logger Cloud: https://stats.uptimerobot.com/tA1F7mCPao