Research
Things I enjoy thinking about and developing, usually around multi-modal data fusion, remote sensing, computer vision, measurements and physics, applied to things I like — roller coasters, LEGO and transportation.
Coaster Fusion is a collection of AI and sensor fusion models powering the Coaster Logger app. It takes consumer-grade accelerometer, gyroscope, barometer, GPS, microphone and heart rate data from smartphones and smartwatches, and produces an accurate 3D digital twin model of each ride experience. From this digital representation, the complete roller coaster track and other key metrics, such as the real height, speed, g-forces are derived. It also estimates roller coaster specific metrics, such as inversions, drops and airtimes. See https://www.tszheichoi.com/coaster-fusion
I lead the research and development work around data fusion at Valerann. We combine traffic, event, weather and risk signals from various data sources in real-time to improve road operator’s situational awareness, using techniques such as fuzzy logic, spatio-temporal modelling and probabilistic reasoning. We also look after the engineering and scalability of the pipeline. See Choi et al. (Dec, 2023) System and Method for Providing Consolidated Events in a Traffic Management Control Centre Using Situational Awareness (US Patent No. 12,118,881)
I lead the development of multi-modal, foundational traffic models that leverage contemporary AI architectures, generative models, and probabilistic inference to revolutionize incident detection for road operators. These models integrate data from IoT sensors, connected vehicles, and infrastructure telemetry, enabling higher precision and faster response times than conventional systems.
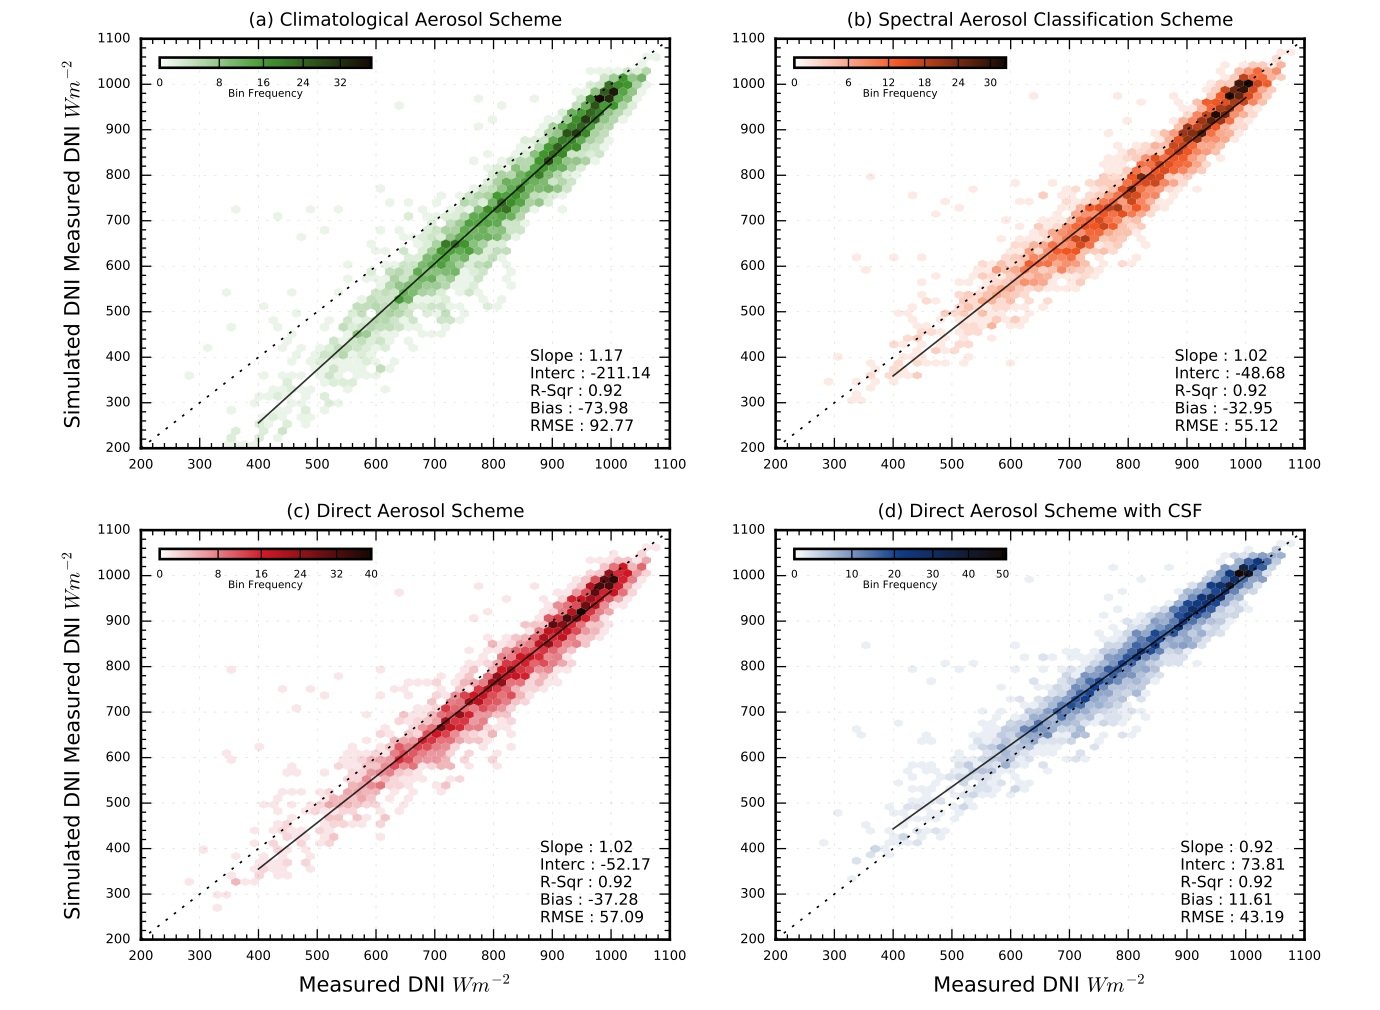
My PhD research focused on improving solar panel deployment and efficiency based on real, long-term observations. This is achieved through the use of earth observation techniques to better understand the global distribution of solar energy resources. See Choi et al. (2021). Developing Automated Methods to Estimate Spectrally Resolved Direct Normal Irradiance for Solar Energy Applications. See https://www.tszheichoi.com/myphdresearch. Also see Renewable Energy. https://doi.org/10.1016/j.renene.2021.03.127
Using remote sensing observations of nitrogen dioxide (NO2) and aerosol optical depth during the COVID-19 lockdown, this study illustrates one of the potential hidden benefits of a cleaner atmosphere is more efficient large scale solar energy generation. See Choi et. al. (2020). COVID-19 lockdown air quality change implications for solar energy generation over China. See https://www.tszheichoi.com/lockdown-solar-energy. Environ. Res. Lett.https://doi.org/10.1088/1748-9326/abd42f
Developing a machine learning based model to predict canopy temperature for agricultural applications. The model has been trained against multi-year ground-based observations of canopy temperature at select Colombian coffee farms. Inputs include GOES 16 & 17, MODIS AQUA & TERRA skin temperature, ERA 5 2 metre air temperature as well as auxiliary information such as high-resolution elevation and solar zenith angle. Learn more at https://youtu.be/R3K7mSlgiUI
I’ve worked on various computer vision algorithms for roadside traffic cameras. Algorithms include automatic camera viewpoint localisation, automated masking for moveable (PTZ) cameras and static object detection. See, for example, System and Method for Determining a Viewpoint of a Traffic Camera (US Patent No. 11,557,089)
I maintain a Github repository of tools, documentations and scripts for researchers to use smartphone sensors for their data collection and research. From how to process data, to documentation on coordinate systems, sampling frequencies and how to setup HTTP Push / MQTT Brokers, this repository has been cited by many researchers across many fields. See https://github.com/tszheichoi/awesome-sensor-logger
Tools & Apps
Things I have built that others have used — from websites to apps and full data platforms.
WKBrew is a tool, built with React, that helps you convert between Well-Known Binary (WKB), Well- Known Text (WKT), and GeoJSON formats. All conversions happen locally in your browser -- no data is sent to a server. See https://wkbrew.tszheichoi.com/
This interactive visualisation developed as part of my PhD work shows the effects of how atmospheric constituents and viewing geometry affect the spectral circumsolar normal irradiance. For more, please refer to one of the videos listed above. See https://imperialcollegelondon.github.io/circumsolar/
Coaster Logger is your ultimate companion for tracking and analyzing your roller coaster adventures automatically. Place your phone securely in your pocket before riding, or record from your smartwatch, and let the app do the rest. Once your ride is over, dive into beautiful 3D track re-creations, detailed ride statistics, and comprehensive analyses of your experience. For each tracked coaster, you get a beautifully recreated, interactive 3D model, as well as a detailed analysis based on your ride experience. See https://www.tszheichoi.com/coaster-logger
Sensor Logger is an easy-to-use, beautifully designed data logger that logs readings from common sensors on your Android phone, iPhone, iPad, AirPods, Apple Watch and WearOS Watch — including accelerometer, gyroscope, GPS, audio, camera and any nearby Bluetooth devices. You can also log device properties such as screen brightness, battery level, temperature and network state. See https://www.tszheichoi.com/sensor-logger.
Build, prototype and share notebook-style data dashboards called Story with recordings made using the Sensor Logger app with ease. Visualise data using plots and maps with advanced customisations, and interlace them with text, images and other contextual data. Everything is interactive, so zoom, pan and delve into your data, without losing sight of the big picture story. Story also supports data transformations such as smoothing, taking derivatives and even frequency analysis in just a few clicks. See https://www.tszheichoi.com/stories
Oftentimes, you want to collect smartphone sensor measurements from multiple phones and participants. Sensor Logger’s built-in Studies is an out-of-the-box solution for crowd-sourcing recordings in a streamlined way. You can control how data should be collected from the participants, ensuring data consistency. Participants can send their recordings back to you seamlessly via Sensor Logger’s secure cloud in a single tap, all whilst being privacy compliant. You can even set up custom questionnaires for participants to fill out to accompany their contributions. See https://www.tszheichoi.com/studies
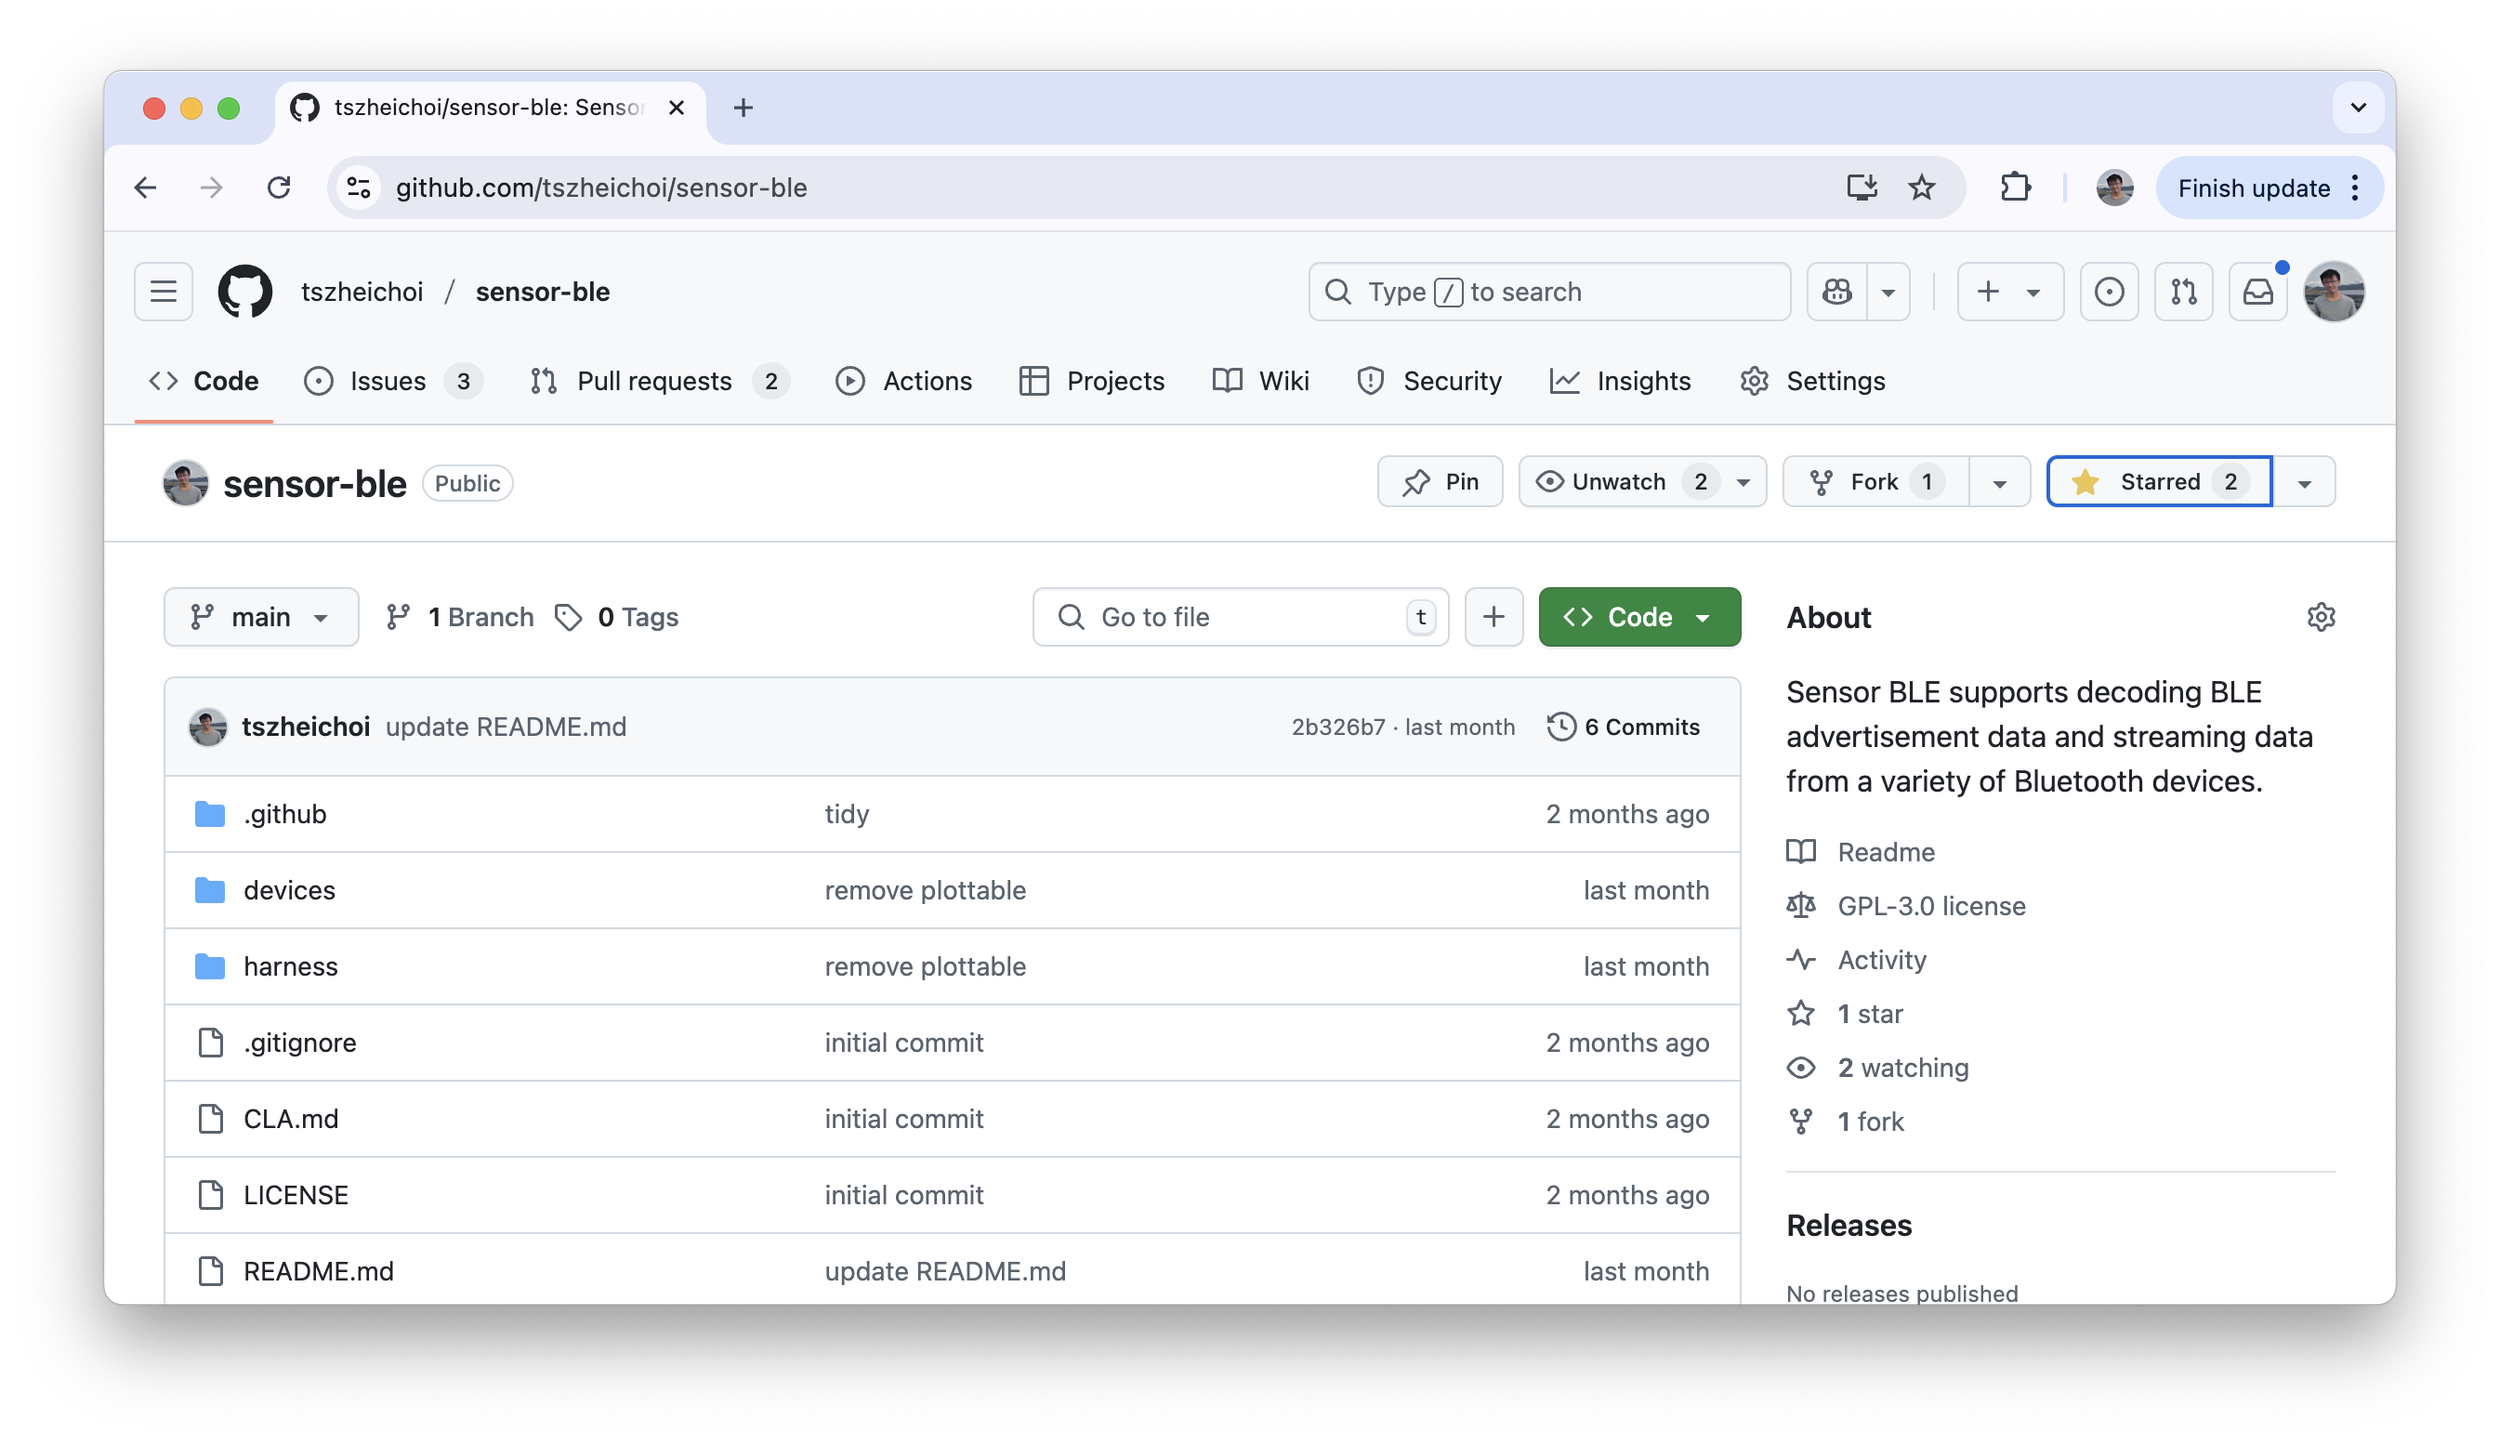
This open source project fills the gap in the market for a simple library for connecting and decoding BLE devices. This allows for community contribution to the Bluetooth features in the Sensor Logger app.
Others
Design, architecture, outreach and other hobbies.
Fourteen observational swaths from the near-polar, sun-synchronous orbit of the SLSTR (The Sea and Land Surface Temperature Radiometer) onboard the European Space Agency’s Sentinel 3 satellite on 19 Oct 2018 have been overlaid on a stylised LEGO relief map in cylindrical projection. Spectral mismatch factors against the standard ASTM AM 1.5 spectrum has been determined based on these satellite measurements. These spectral mismatch factors can then be used to optimise the design of multi-junction cells to improve their efficiencies for any particular location on earth. In total, some 20,000 bricks have been hand-placed for this model, which is built to 1:12500000 at the equator. Produced as part of the Research as Art competition at Imperial College (Jul 2019). https://www.youtube.com/watch?v=HNP9Lwl663w
This is an experimental work on exploring the possibility of projection mapping on LEGO sets with automated calibration. Whilst inspired by the rich third-party market of LED lighting kits for official sets, projection mapping offers the potential of dynamically overlaying exciting effects and contents on LEGO sets. See https://www.tszheichoi.com/projectionmapping
Shipping comprises 18% of the global emission of sulphur containing species, some of which oxidise to form sulphate aerosols. This aerosol is an efficient cloud condensation nuclei, thus creating shiptracks. Here you may steer a shipping container with varying aerosol emissions. Notice how the emitted aerosols interact with the low cloud fields and the radiative effect the shiptracks have on the scene.
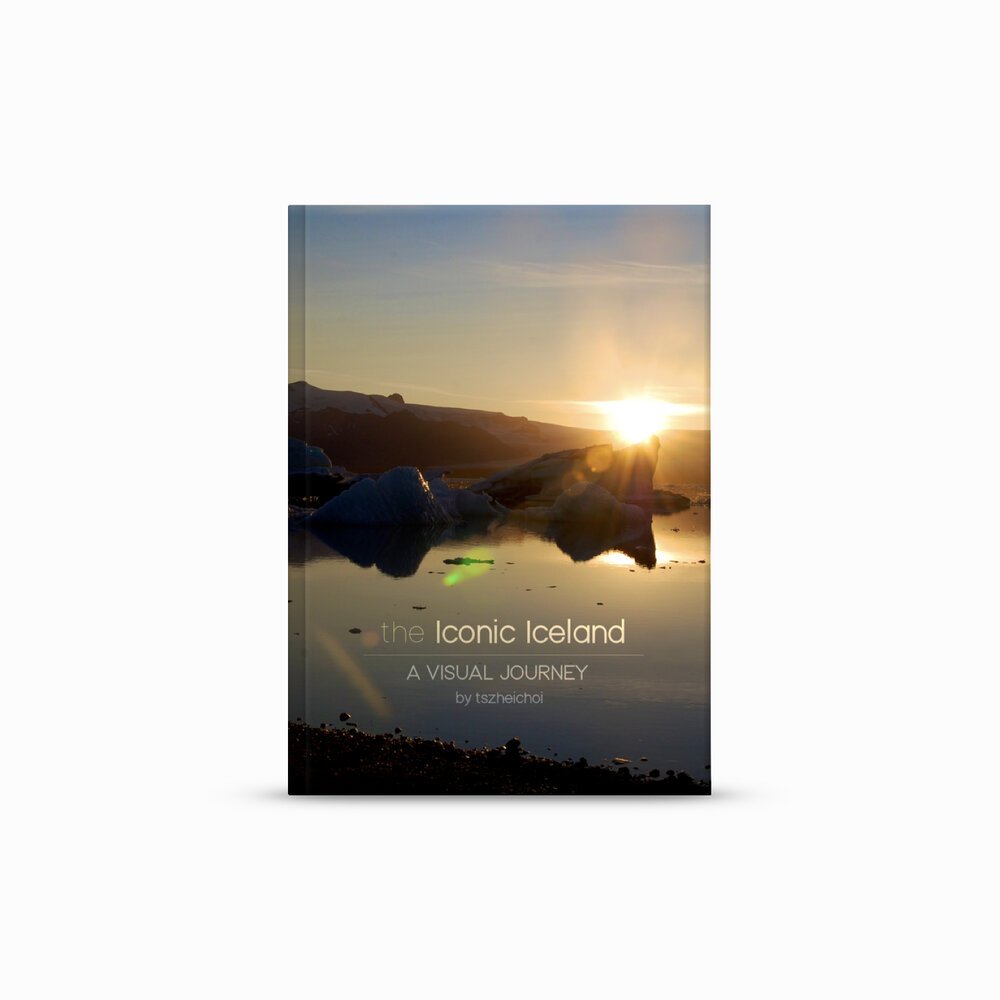
The Iconic Iceland is a 250-page photo book that showcases the visual inspirations of Icelandic landscapes. Intricately sculpted by ice, fire, water and earth, Iceland is perhaps the most elegant embodiment of the saying that nature is indeed the ultimate architect. Featuring breathtaking original photos and videos accompanied by hand sketches, this book explores how we can abstract quintessential design elements such as colour, contour, motion and texture from the panoramas of Iceland. https://www.tszheichoi.com/book
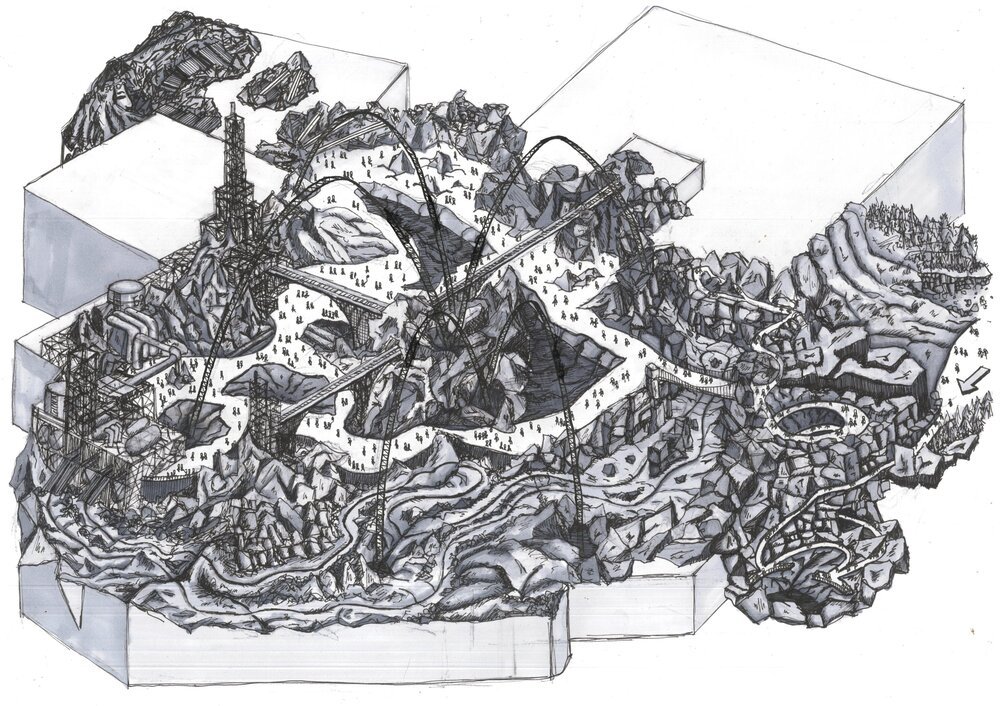
The Blue Armchair is a blog dedicated to new ideas and concepts for themed entertainment, including theme parks, museums and more. Ultimately, we're trying to explore how fusing technology, architecture and storytelling can create immersive experiences that transcend space, time and emotions. See https://www.tszheichoi.com/blue-armchair


